
MpAndroidChart Line Chart Example in 7 Easy Steps we will be exploring MPAndroidChart library to create a line chart with multiple lines.
Need some career advice or prepping for an Android developer interview? Hit me up on Topmate.io, and let's chat!
For a greater understanding and impact on your data, it requires to be pictured. In this tutorial, we will be exploring MPAndroidChart to create a line chart with multiple lines.

Thus, LineChart is an android application that puts together sales records of various products sold out in a two week period with the help of a line chart. Let’s dive into the steps to get started!
MpAndroidChart Line Chart Example
Step 1: Add the dependency
To implement MPAndroidChart library in our project, it needs to be imported into the android package.
Add the below repository in setting.gradle file
repositories {
...
maven { url 'https://jitpack.io' }
}
Add this to build.gradle (app level) file
dependencies {
   ...
   implementation 'com.github.PhilJay:MPAndroidChart:v3.1.0'
}
Make sure to sync your gradle after including the above lines.
Step 2: Layout Binding
Include the line chart widget in your XML file to present your view in the activity.
<com.github.mikephil.charting.charts.LineChart
   android:id="@+id/lineChart"
   android:layout_width="match_parent"
   android:layout_height="match_parent"
   android:layout_margin="40dp"/>
Step 3: Create an Activity
Firstly, add the XML Layout which consists of the line chart in setContentView() method.
class LineChart : AppCompatActivity() {
   override fun onCreate(savedInstanceState: Bundle?) {
       super.onCreate(savedInstanceState)
       setContentView(R.layout.activity_main)
   }
Step 4: Configure the Line Chart
To change the appearance, create a function that defines various properties and axes visibility of the MpAndroidChart Line Chart. This method is later called in onCreate() after setting the view.
private fun setUpLineChart() {
   with(lineChart) {
animateX(1200, Easing.EaseInSine)
description.isEnabled = false

xAxis.setDrawGridLines(false)
xAxis.position = XAxis.XAxisPosition.BOTTOM
xAxis.granularity = 1F
xAxis.valueFormatter = MyAxisFormatter()

axisRight.isEnabled = false
extraRightOffset = 30f

legend.orientation = Legend.LegendOrientation.VERTICAL
legend.verticalAlignment = Legend.LegendVerticalAlignment.TOP
legend.horizontalAlignment = Legend.LegendHorizontalAlignment.CENTER
legend.textSize = 15F
legend.form = Legend.LegendForm.LINE
   }
}
MpAndroidChart Line Chart Example offers a wide range of attributes to customize any chart. A quick overthrough all the properties used in the above code.
animateX – flows the data in an animation style along X-axis. Being a line chart, line-movement horizontally is more appealing than any other.
description – this is a short one-line narrative about the chart.
setDrawGridLines – lines that extend from the x-axis values.
position – the spot at which x-axis is located in the line chart.
granularity – spacing between each of x-axis values.
valueFormatter – By default, line chart values are float in nature in MPAndroidChart. We can specify our custom value type through this property.
extraRightOffset – to modify the viewport. Generally used when any data is being clipped off
legend – represents multiple entries used in the line chart with their respective labels.
Step 5: Display Item name as values in X-axis
This is where we assign the list of products as values in the x-axis. Create an inner class within the file which extends IndexAxisValueFormatter. Simply override the function getAxisLabel() and return your item element as the value.
inner class MyAxisFormatter : IndexAxisValueFormatter() {

   private var items = arrayListOf("Milk", "Butter", "Cheese", "Ice cream", "Milkshake")

   override fun getAxisLabel(value: Float, axis: AxisBase?): String? {
       val index = value.toInt()
       return if (index < items.size) {
           items[index]
       } else {
           null
       }
   }
}
Step 6: Prepare your data to be displayed in the Line chart
As we are displaying sales of a two week period, create two functions for each of the week. Entry refers to the data point on the chart in xAxis and yAxis. Sales is a collection of the amount of products sold for each of the above mentioned items.
private fun week1(): ArrayList<Entry> {
   val sales = ArrayList<Entry>()
   sales.add(Entry(0f, 15f))
   sales.add(Entry(1f, 16f))
   sales.add(Entry(2f, 13f))
   sales.add(Entry(3f, 22f))
   sales.add(Entry(4f, 20f))
   return sales
}

private fun week2(): ArrayList<Entry> {
   val sales = ArrayList<Entry>()
   sales.add(Entry(0f, 11f))
   sales.add(Entry(1f, 13f))
   sales.add(Entry(2f, 18f))
   sales.add(Entry(3f, 16f))
   sales.add(Entry(4f, 22f))
   return sales
}
Step 7: Populate this data to the line chart now
The key step is setting up the data to be displayed. But the data we prepared above is in arraylist form, hence it has to be changed to a form acceptable by line chart – which is LineDataSet.
LineDataSet takes in two parameters:-
- Array list of Entry type (data prepared in Step 6)
- Label – name to the data (in this case, it is called “Week 1”)
private fun setDataToLineChart() {
val weekOneSales = LineDataSet(week1(), "Week 1")
weekOneSales.lineWidth = 3f
weekOneSales.valueTextSize = 15f
weekOneSales.mode = LineDataSet.Mode.CUBIC_BEZIER
weekOneSales.color = ContextCompat.getColor(this, R.color.red)
weekOneSales.valueTextColor = ContextCompat.getColor(this, R.color.red)
weekOneSales.enableDashedLine(20F, 10F, 0F)
val weekTwoSales = LineDataSet(week2(), "Week 2")
weekTwoSales.lineWidth = 3f
weekTwoSales.valueTextSize = 15f
weekTwoSales.mode = LineDataSet.Mode.CUBIC_BEZIER
weekTwoSales.color = ContextCompat.getColor(this, R.color.blue)
weekTwoSales.valueTextColor = ContextCompat.getColor(this, R.color.blue)
weekTwoSales.enableDashedLine(20F, 10F, 0F)
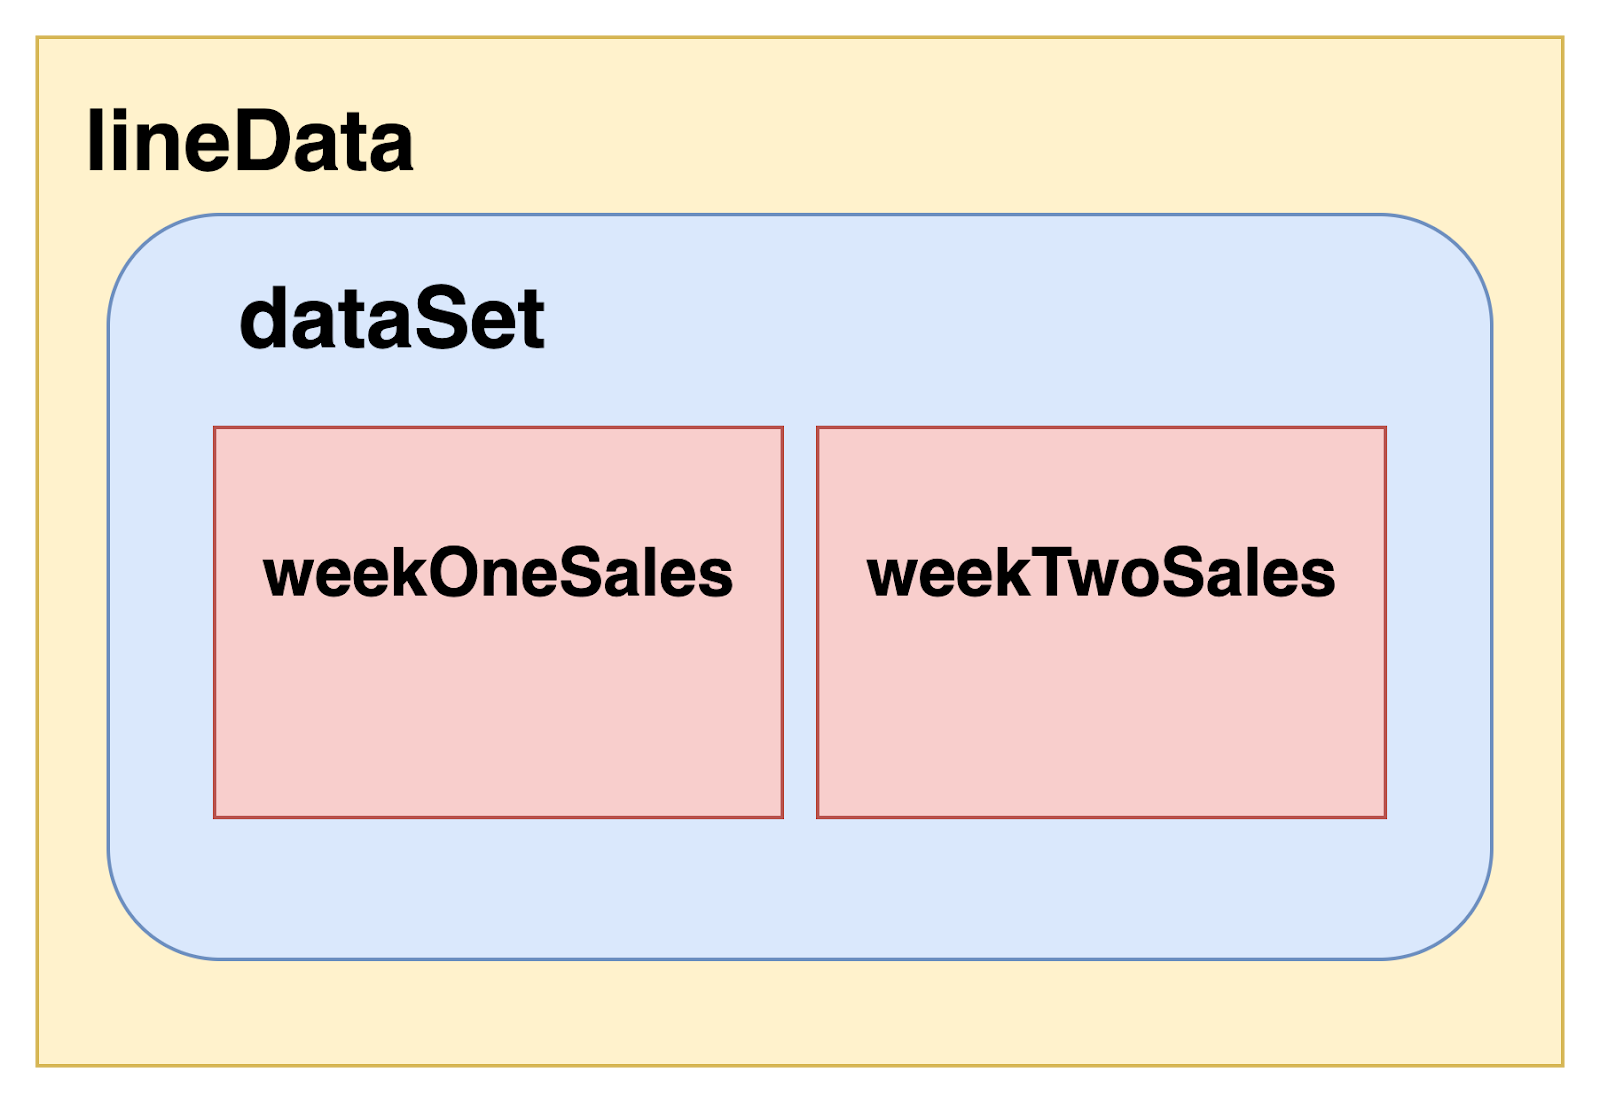
val dataSet = ArrayList<ILineDataSet>()
dataSet.add(weekOneSales)
dataSet.add(weekTwoSales)
val lineData = LineData(dataSet)
lineChart.data = lineData
lineChart.invalidate()
}
Now we will customize both the line data sets for easy differentiation through following properties:-
- lineWidth – thickness of the line
- valueTextSize – dimensions of the text values marked in the line chart.
- mode – style of representing your line.
- color – color of line
- valueTextColor – color of text values marked in the line chart.
- enableDashedLine – length, spacing and phase of the line.
Read more about building your own custom colour picker in Android Studio here.
Moving forward, make a collection of both LineDataSet (weekOneSales and weekTwoSales) called dataSet. Then pass on this dataSet to LineData and assign it to the line chart’s data.
Then use the invalidate() to refresh the display of the line chart.
Conclusion
An overview of the structure format of coding in MpAndroidChart Line Chart Example Application.
Incase you need to refer to the source code, find it here
[instagram-feed feed=1]


